


Looking for the real thing? Browse genuine crusader rings for sale — each piece one-of-one, individually authenticated, with provenance.
What archaeologists mean by "how tall were the Vikings" - definition and context
Timeframe and geographic scope: what we mean by Viking age
When authors or museum labels ask "how tall were the Vikings" they are usually referring to the Viking age in northern Europe, a broad period that is commonly dated to roughly the late 8th through the 11th centuries CE. Studies that try to summarise stature for that era typically draw on human remains from a patchwork of cemeteries and burial sites across Scandinavia and areas influenced by Scandinavian mobility during that period, and readers should note that the temporal and geographic frame matters for interpretation.
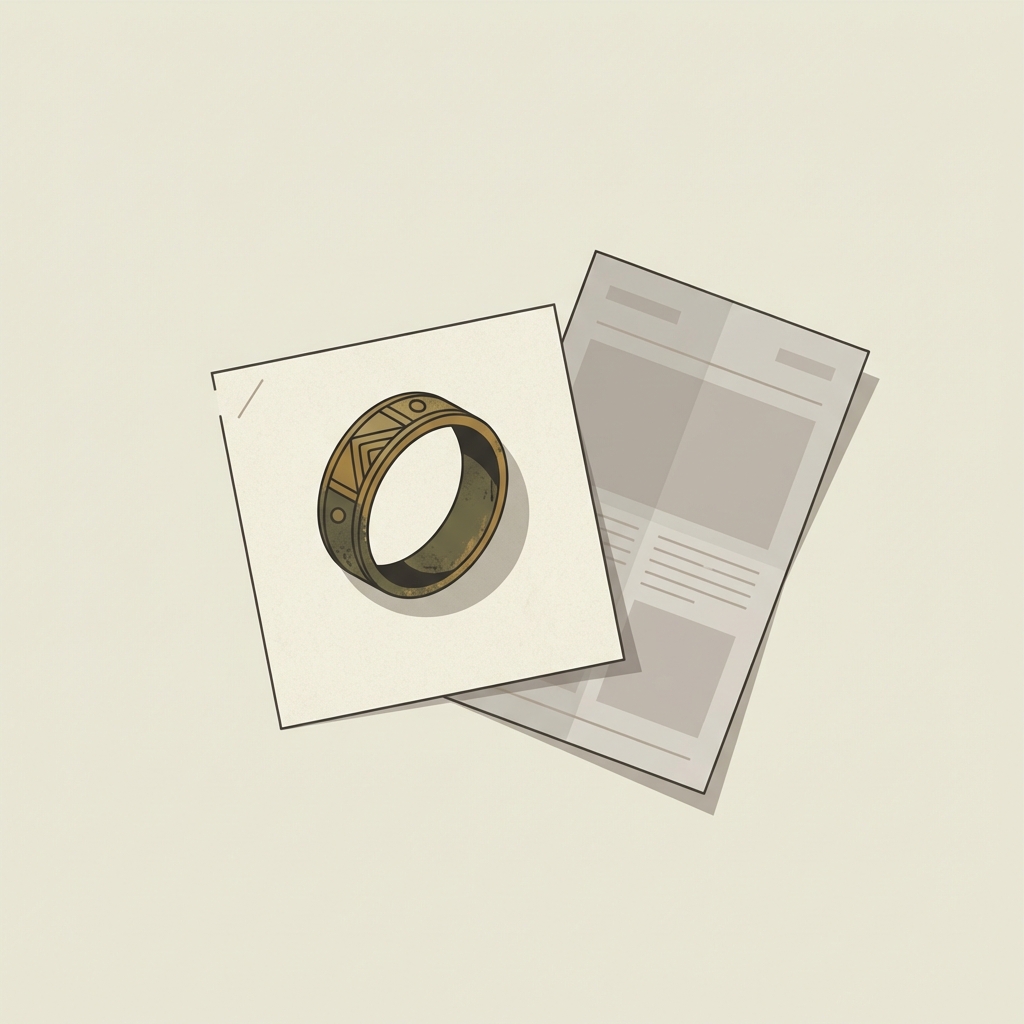
For readers who also browse antiquities listings, including ancient ring offers, it helps to remember that archaeological labels use similarly focused timeframes for dating objects, and the same caution about local context applies when a single site is used to represent a whole region.
Check primary project pages for methods and sample details
Explore project summaries and original site reports to see how researchers frame their sample, method and timeframe before accepting a headline number.
What a population mean tells you and what it does not - ancient viking rings for sale
A population mean for stature is a statistical average derived from a defined sample of individuals. It can indicate a central tendency for that particular burial assemblage, but it does not imply that every person from the period matched that number. Small or selective samples, such as elite graves, can produce means that differ substantially from community level averages. When a report gives a mean without reporting sample size and range, it leaves out crucial context for interpreting how representative that figure is.
For collectors and curious readers, the short practical rule is to treat single grave or media summary heights as local observations rather than continent wide facts, and to check whether a study provides sample size, measurement method and a range alongside any mean.
How stature is estimated from bones - core methods and their limits
Long bone measurements and regression formulae
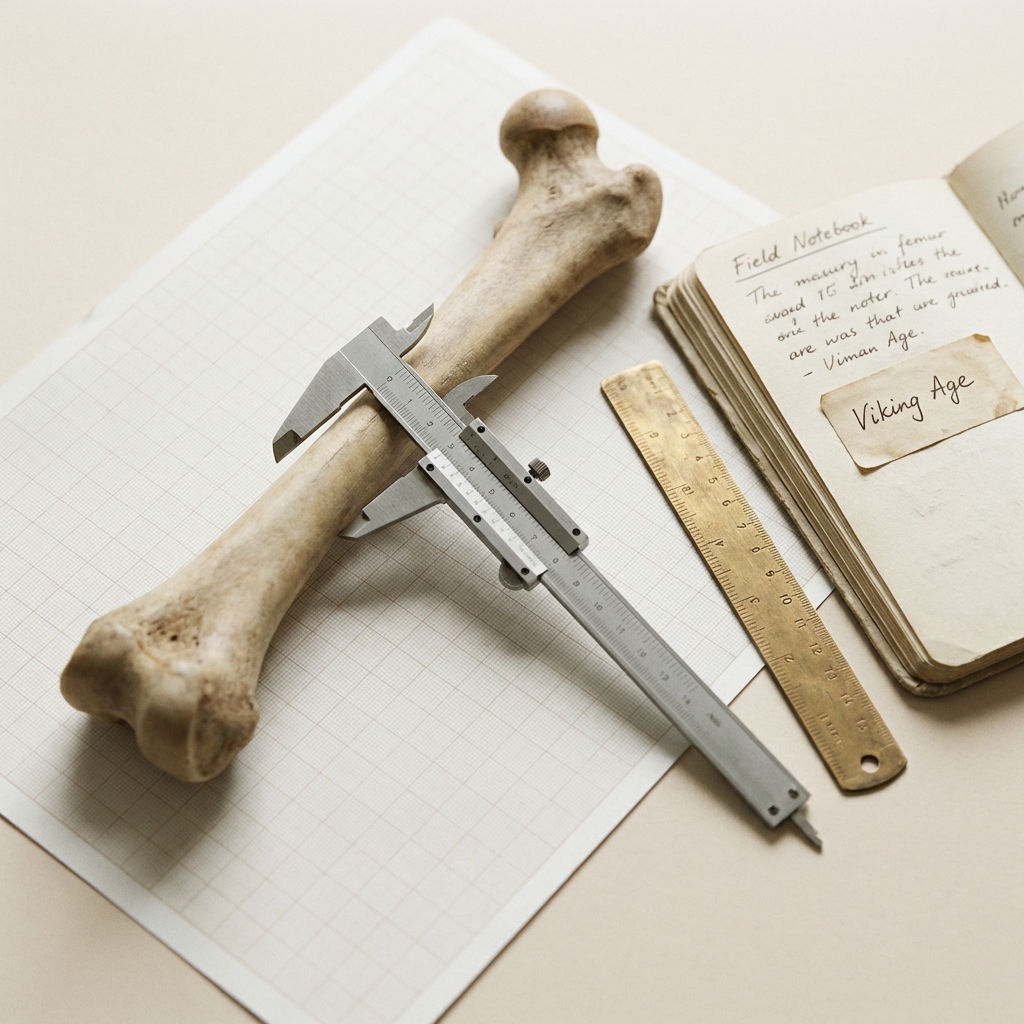
Most stature estimates for past populations are calculated from long bone measurements using established regression formulae. Practitioners measure bones like the femur, tibia and humerus and apply equations that convert bone length to estimated living stature; this approach is the methodological standard and underpins the majority of published stature numbers for Viking age assemblages Trotter and Gleser paper.
Why the choice of formula and population matters
Different regression formulae were derived from different reference populations and eras, so applying an equation developed for one group to bones from another can shift estimates by several centimetres. Recent work therefore prefers population specific or updated formulas when available, and comparative studies will often report results from more than one equation to show how sensitive estimates are to that choice.
Practical note on reporting ranges and sample sizes
Good practice in stature reporting includes giving the measurement method, the regression formula used, the sample size and the range of estimated statures. Reporting a mean without these details obscures uncertainty and makes it hard to compare studies. Measurement error, bone preservation and choices about which elements to include are common sources of variation that readers should look for in site reports and publications.
What recent large projects report - the Great Viking Survey and synthesis findings
Summary of project approach combining osteology, aDNA and isotopes
Recent large collaborative projects combine traditional osteology with ancient DNA and isotope analysis to produce more nuanced pictures of past populations. One such multi disciplinary effort synthesises bone measurements with genetic and isotopic data to examine how ancestry and diet may relate to stature patterns across sites Great Viking Survey.
Reported central tendencies and how to read them
Large syntheses report central tendencies such as mean male and female statures while also emphasising local variation and methodological caveats. Published syntheses in the last few years typically find male mean statures commonly in the mid 160s to low 170s centimetres across sampled Scandinavian sites, with female means often lower by around 10 to 15 centimetres; however these are aggregated findings and should be read alongside reported ranges and sample sizes to understand local differences Great Viking Survey project summary.
Researchers estimate stature using long bone regression formulae and increasingly combine osteology with ancient DNA and isotope analysis to explain differences; reliability depends on method transparency, sample size and whether studies report ranges and potential biases.
When you read a headline that gives a single number for Viking height, check whether the report provides the underlying sample metadata and which regression formula was used before treating that number as a general rule.
Regional and temporal variation - why some samples look taller than others
Examples from cemetery and mass grave assemblages
Not all burial assemblages produce the same stature profile. Some cemetery series and certain mass grave assemblages in parts of Sweden and Norway include individuals who are notably taller than averages reported from other regions, with several individuals and subgroups near or above 175 to 180 centimetres in some cases. These local elevations are visible when publications provide individual estimated statures and ranges rather than only an aggregated mean Birka site reports (Birka isotope study).
Factors that produce local differences: diet, ancestry, social selection
Local dietary practices, genetic background and social selection into particular burial rites can all affect which bodies enter a cemetery and thus the stature profile that researchers observe. For example, sites with evidence for high protein diets or particular ancestry components can show taller local means, while elite or warrior burials may overrepresent individuals who were taller than the general population.
Sample composition is therefore key: a set of graves associated with a martial context or with high status goods can skew a mean upward relative to a community wide sample, and readers should look for explicit discussion of burial selection in site reports.
Genes, diet and mobility - biological explanations behind stature differences
What aDNA and isotopes add to stature studies
Combining isotope analysis and ancient DNA with osteology allows researchers to test whether ancestry and diet are associated with stature differences across samples. Genetic markers can indicate ancestry components that correlate with stature tendencies, while isotopes of nitrogen and carbon provide information on the protein portion of diet that can influence growth during childhood Great Viking Survey project summary.

Limits of causal interpretation and ongoing research questions
The presence of an association between ancestry, diet and stature in some samples does not automatically establish direct causation for every site; mobility, mixed ancestry during the Viking expansion and local ecological factors complicate interpretation. Researchers continue to harmonise datasets and expand sample sizes to test how consistent these associations are across space and time Great Viking Survey.
How to read and report Viking stature numbers - practical guidelines
Checklist for readers and writers
When you encounter a reported stature mean, apply a short checklist: confirm the measurement method, ask which regression formula was used, note the sample size and the range of estimates, and check for any discussion of sample selection or preservation issues. Prefer population specific formulae when they are reported and avoid quoting a mean without its context Trotter and Gleser paper.
How to compare studies responsibly
To compare two studies, make sure they used comparable methods and formulas, and compare sample sizes and date ranges. If one study reports a mean based on a handful of unusually preserved adult males and another reports a community wide sample with hundreds of individuals, the two means are not directly comparable without adjusting for those differences.
Common mistakes and pitfalls to avoid when reading Viking height claims
Misreading small or biased samples
A frequent mistake is treating a small or selectively recovered sample as representative. Small sample sizes produce unstable estimates and can be heavily influenced by a few tall individuals. Preservation bias is also common: better preserved skeletons may come from particular contexts that are not representative of the whole community Trotter and Gleser paper.
Simple template to compare study metadata across reports
Use this to record method before citing a number
Overinterpreting single graves or sensational media summaries
Media summaries and single grave reports can be vivid and memorable but they can also mislead if presented without context. Sensational headlines that generalise from ad hoc samples are common; instead, consult original site reports or synthesis pages which tend to present sample metadata, methods and discussion of bias Great Viking Survey project summary.
Practical examples: reading a site report and comparing two samples
Step by step reading of a hypothetical site summary
Start with the methods section: note which bones were measured, which regression formula was applied and whether the authors report individual estimated statures or only an aggregated mean. Record sample size and the date range of burials. From that baseline you can appraise how far the reported mean is supported by the underlying data Birka site reports.
Comparing two published means: what to check
When comparing two published means, check that both used similar formulas or, if not, that authors report converted estimates. Compare sample sizes and whether either sample is clearly selective for social status or burial context. Differences of a few centimetres may fall within methodological uncertainty, while larger differences that persist across methods are more likely to reflect genuine local variation.
In practical terms, if one cemetery mean is reported as mid 160s and another as low 170s centimetres, look for the sample sizes and whether one set comes from a context with nutritional or ancestral differences before concluding that the populations had different average statures.
Conclusion: what we can say in 2026 about Viking stature
By 2026 the cautious synthesis is that Viking age stature varied by region and context, with aggregated syntheses often reporting male means in the mid 160s to low 170s centimetres and female means commonly lower by around 10 to 15 centimetres, but with notable local exceptions. The best practice for reporting remains to state the measurement method, the regression formula, the sample size and the range alongside any mean to make clear what the number represents Great Viking Survey.
Open questions include the full pan Scandinavian population mean after datasets are harmonised, the effects of mobility and mixed ancestry during the Viking expansion, and the degree to which burial sampling biases alter published averages. Readers and collectors who want to understand reported numbers should prioritise site reports and synthesis pages that present metadata and discussion rather than isolated headlines.
Researchers estimate stature from long bones using regression formulae; good reports specify which formula was used, sample size and the range of estimates.
No. Stature varied by region, diet, ancestry and sample selection, so single site means should not be generalized to all Viking era populations.
Consult original site reports and large syntheses like the Great Viking Survey, and check that studies report methods, formulae, sample sizes and ranges.
References
- https://auroraantiqua.com/collections/rings
- https://auroraantiqua.com/blogs/questions-and-answers
- https://auroraantiqua.com/collections/highlights
- https://onlinelibrary.wiley.com/doi/10.1002/ajpa.1330280302
- https://vikingsurvey.org/
- https://www.hf.uio.no/ils/english/research/projects/vikingsurvey/
- https://www.raa.se/en/what-we-do/excavation-reports/birka/
- https://lup.lub.lu.se/search/files/35490534/Isotopes_Birka_main.pdf
- https://pmc.ncbi.nlm.nih.gov/articles/PMC9579023/
- https://www.nature.com/articles/s41586-024-08275-2
- https://auroraantiqua.com/products/authentic-medieval-crusader-era-bronze-cross-orbis-10th-14th-century-ce-christian-pendant-medieval-cross-pendant
From Aurora Antiqua
We sell authenticated ancient & medieval pieces — each individually researched against a 73,000-reference corpus and backed by a Lifetime Authenticity Guarantee. One of a kind, sold once, never reproduced.
Browse Medieval & Crusader Rings →